Debugging is a crucial part of the development process, especially when working with complex React applications. As a software developer, you're bound to encounter various error messages, performance bottlenecks, and unexpected behavior during the development of React apps. Efficiently identifying and fixing issues in React code is essential for ensuring a smooth user interface and maintaining high code quality.
One of the key challenges developers face is understanding the React component tree and pinpointing where an error occurs. Errors in lifecycle methods, event handling, or component rendering can lead to logic errors, performance issues, or networking errors. With the vast range of debugging tools and techniques available, React developers can use the right approach to effectively identify and fix the root cause of common errors.
In this article, we will explore tips and tricks for debugging React applications, using both built-in and third-party tools such as React Developer Tools and browser developer tools. You will learn how to inspect the component hierarchy, monitor network requests, capture and handle errors, and log relevant data, all to streamline your debugging process. Additionally, we will look at how to improve application performance using the Profiler tool and handle errors gracefully with error boundaries.
One of the most powerful debugging tools available for React developers is the React Developer Tools. This browser extension allows you to inspect your React component tree, view state and props, and monitor component rendering.
The Components Tab provides a clear view of the component hierarchy in your React app. You can inspect individual React components, see the relevant data like props and state, and understand how data flows through your application. This is essential when debugging issues related to user interface and component rendering.
console.log("State:", this.state);
console.log("Props:", this.props);The Profiler Tab helps identify performance issues by showing which React components are re-rendering unnecessarily. This tool allows you to understand the root cause of slow component rendering and optimize React development.
const MemoizedComponent = React.memo(MyComponent);While console logging is a basic debugging technique, it's crucial to use it efficiently. Console logging can help identify logic errors, monitor lifecycle methods, and track network requests. However, too many console.log() statements can clutter the console.
Using other console methods such as console.table() to log arrays or objects, console.warn() to highlight potential issues, and console.error() for error messages can make your logs more organized.
console.table(myArray);
console.warn("Warning: Something is off!");
console.error("Error:", errorObject);Error Boundaries are special React components designed to catch JavaScript errors that occur during component rendering. This prevents your entire React application from crashing. Error boundaries handle error messages gracefully by displaying fallback UIs when an error occurs.
class ErrorBoundary extends React.Component {
  constructor(props) {
    super(props);
    this.state = { hasError: false };
  }

  static getDerivedStateFromError(error) {
    return { hasError: true };
  }

  render() {
    if (this.state.hasError) {
      return <h1>Something went wrong.</h1>;
    }
    return this.props.children;
  }
}
Use error boundaries around sections of your app where JavaScript errors are most likely to occur, such as in third-party components.
Some common errors in React development include mixing controlled and uncontrolled components, not updating state correctly, or using incorrect initial values.
When updating state using setState or useState, it's important to handle asynchronous updates properly. For example, always use the previous state to update a counter:
setState((prevState) => ({ count: prevState.count + 1 }));This ensures that the state updates are consistent, even when multiple updates occur in rapid succession.
Instead of relying solely on console logs, you can use breakpoints in the browser's developer tools to pause code execution and inspect variables step by step. This is useful for debugging react code as it allows for more targeted inspection.
Conditional breakpoints let you pause the code execution only when certain conditions are met. For example, you can set a breakpoint in a function but only trigger it if the input value is a specific number.
if (inputValue === 5) {
  debugger; // pauses the code only when inputValue equals 5
}Excessive re-renders in React applications can cause performance issues. Tools like React.memo(), useCallback(), and useMemo() help to optimize performance by preventing unnecessary re-renders.
Use React DevTools to check when a component re-renders and if the re-renders are avoidable. You can also use libraries like why-did-you-render to track down these problems.
const MemoizedComponent = React.memo(MyComponent);One of the most common mistakes with React hooks is forgetting to include dependency arrays in functions like useEffect. This can lead to unexpected behavior when the hook doesn't re-run as expected.
useEffect(() => {
  // effect code
}, [dependency]); // Make sure to include all relevant dependencies hereTools like eslint-plugin-react-hooks can catch these mistakes and ensure that your React hooks are used correctly.
Third-party debugging libraries provide specialized tools and features that go beyond the basic debugging capabilities of browser DevTools and React Developer Tools.
They are particularly useful for identifying complex issues related to state management, performance optimization, and error handling in React applications. Here’s a closer look at some popular third-party debugging libraries:
Redux DevTools is specifically designed for Redux state management, offering features like time travel debugging, action and state inspection, and manual state modification. These capabilities allow developers to navigate between different states of their application, inspect dispatched actions and their payloads, and optimize state changes effectively by monitoring how actions alter the state over time.
Why-Did-You-Render is a performance-focused tool that helps identify unnecessary component re-renders in React applications. It tracks specified components to check if they re-render unnecessarily due to shallow prop or state changes, providing detailed logs that explain the reasons behind each re-render. Additionally, it offers optimization suggestions, helping developers understand which components could benefit from techniques like React.memo or useCallback.
React-Error-Overlay enhances the development experience by catching runtime errors and displaying them in full-screen overlays with detailed error messages and stack traces. It supports source maps to show errors in the context of the original code, making it easier to pinpoint issues. The tool also provides interactive stack traces, allowing developers to click on entries to open the corresponding line of code in their editor, streamlining the debugging process.
While not strictly a debugging tool, React Testing Library combined with Jest provides a robust framework for writing tests that catch issues before they reach production. It allows for component testing in isolation, ensuring that they behave correctly with various states and props. The library includes utilities for accessibility checks and provides capabilities to mock functions and components, enabling deeper insights into how components interact with each other.
Sentry and LogRocket are essential monitoring and error-tracking tools that provide detailed insights into how React applications perform in production. They automatically capture real-time errors and performance issues, while LogRocket allows developers to replay user sessions to see exactly what happened before an error occurred. Both tools offer contextual data around errors, including stack traces and user actions, and provide alerting features to notify developers immediately when issues arise, facilitating quicker response times. Incorporating these libraries into your workflow can significantly improve your debugging efficiency and application reliability.
Consider your browser’s developer tools as your dependable companion. Tools like Chrome DevTools come packed with a variety of features designed to help you identify and troubleshoot issues effectively:
Using console.log(), console.error(), console.warn(), etc., to print values and understand the flow of the application.

Using the Elements tab you can explore your rendered components. You can inspect the component rendered DOM tree in detail to identify any inconsistencies or missing elements.

Using the Network tab allows us to monitor network requests, responses, and payloads, making it an essential tool for debugging API calls and data fetching problems.

Using the debugger statement into your code, you can step through your code line by line, allowing you to trace back and pinpoint the error message and exact moment where the issue occurred.
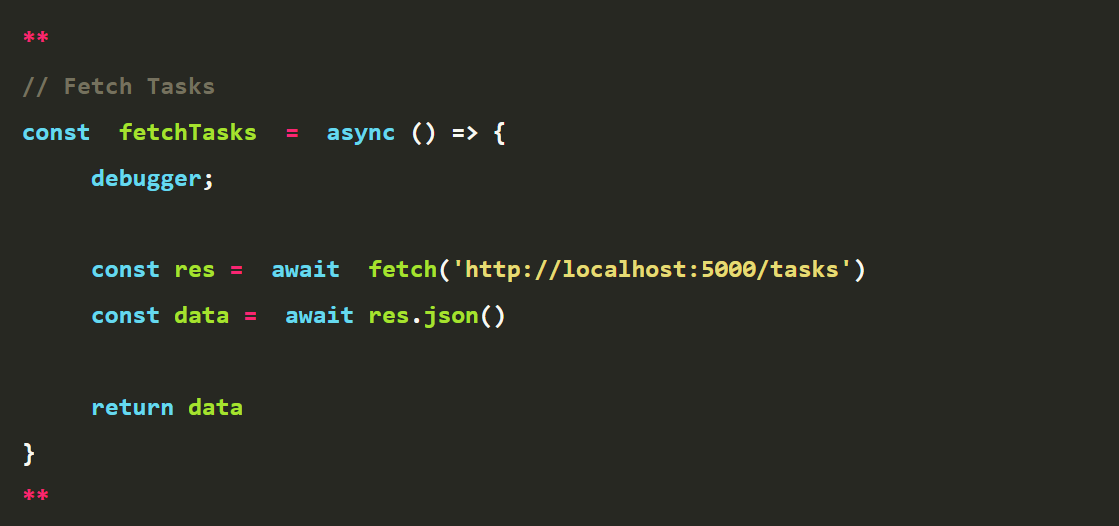
In the browser, you'll notice that Chrome DevTools has paused code execution exactly where the `debugger` statement was inserted, indicating that the tasks haven't been loaded yet.

To debug React code in Visual Studio Code, start by installing the Debugger for Chrome extension, which allows you to launch Chrome or connect to an existing Chrome session directly from the editor. You can find and install this extension through the Visual Studio Marketplace.
Once the extension is installed, you'll need to set up a debugging configuration by creating a launch.json file. This file defines the settings for your debugging environment.
To create it, click on the Debug icon in the left sidebar of Visual Studio Code, then click on the "create a launch.json file" link. From the available templates, select "Chrome: Launch." This action will generate a launch.json file pre-filled with the basic configuration needed for debugging with Chrome.
This setup will help you seamlessly run and debug your React application directly from within Visual Studio Code.
{
  "version": "0.2.0",
  "configurations": [
    {
      "type": "chrome",
      "request": "launch",
      "name": "Launch Chrome against localhost",
      "url": "http://localhost:3000",
      "webRoot": "${workspaceFolder}"
    }
  ]
}
You can customize the `launch.json` file based on your project’s requirements, such as setting the port number, webroot, or source map options.
To start debugging the React app, first, run your React application on your local server. Then, in Visual Studio Code, click the Run and Debug button located in the left sidebar. This will launch a new Chrome window displaying your application, which will automatically connect to the editor for debugging.
To set a breakpoint, simply click on the left margin next to the line of code where you want execution to pause; a red dot will appear to indicate the breakpoint is active. You can also add conditional breakpoints, log points, or function breakpoints by right-clicking the margin and selecting the desired option.
For inspecting variables, use the Variables panel, which shows both local and global variables in the current scope. The Watch panel allows you to add expressions that will be evaluated in the current context, and hovering over a variable or expression in the code editor will display its value in a tooltip.
To control the flow of execution, utilize the Debug Toolbar, which offers controls for stepping over, stepping into, stepping out, continuing, or stopping execution. You can also use keyboard shortcuts like F10 (step over), F11 (step into), Shift+F11 (step out), F5 (continue), and Shift+F5 (stop).
To view the sequence of function calls leading to the current breakpoint, use the Call Stack panel. This panel lists all functions that were called, and clicking on any function in the call stack will jump to that location in the code editor.
Visual Studio Code also provides other helpful debugging tools, such as the Breakpoints panel, which displays all breakpoints in your project, the Debug Console panel for viewing debugger output and entering commands, and the Problems panel, which highlights errors and warnings in your code.
Linting and Static Code Analysis play a crucial role in maintaining code quality and catching potential issues early in the development process. These tools help enforce coding standards, prevent common errors, and improve the overall readability and maintainability of your codebase. Let’s dive deeper into how these tools work and their benefits:
Purpose: Linting and static code analysis are techniques used to analyze your code for potential errors, coding standard violations, and other quality issues without actually running the code. They help enforce best practices and coding conventions, which leads to cleaner, more reliable code.
Using ESLint:
ESLint is one of the most popular linting tools for JavaScript and TypeScript projects, including React applications. It parses your code and applies a set of rules to detect syntax errors, code smells, and patterns that can lead to bugs.
React-Specific Plugins: By using plugins like eslint-plugin-react, ESLint can be tailored specifically for React applications. This plugin includes rules for best practices, hooks usage, JSX formatting, and even accessibility checks, helping to enforce proper use of React components.
Customization: ESLint is highly customizable, allowing you to define your own rules or extend from popular configurations like Airbnb, Google, or Standard. You can also enable specific rules for your team’s coding guidelines, ensuring consistency across your codebase.
Accessibility: With additional plugins like eslint-plugin-jsx-a11y, ESLint can also help detect accessibility issues in your JSX, ensuring that your React components adhere to accessibility standards.
Benefits:
Prevents Errors: Catches syntax errors, missing imports, undefined variables, and more before the code is executed.
Enforces Consistency: Helps maintain a consistent coding style across your project, making the code easier to read and maintain.
Improves Code Quality: Encourages best practices and can enforce rules that prevent common pitfalls in JavaScript and React.
Boosts Accessibility: Ensures that your components are built with accessibility in mind, which is crucial for creating inclusive web applications.
Purpose: Code formatters and type checkers focus on maintaining consistent code style and catching type-related errors early in the development process. They improve the readability of code and reduce the likelihood of bugs caused by type mismatches.
Using Prettier:
Prettier is an opinionated code formatter that automatically formats your code according to a set of predefined rules. It supports JavaScript, TypeScript, HTML, CSS, and many other languages.
Consistency: Prettier removes the need for debates over code style, as it enforces a uniform code style throughout the project. It formats your code on save, reducing manual formatting efforts.
Integration: Prettier integrates well with various editors and tools, such as Visual Studio Code, Git hooks, and CI/CD pipelines, ensuring consistent formatting across the entire team.
Using Type Checkers (TypeScript and PropTypes):
TypeScript: TypeScript is a superset of JavaScript that adds static typing to the language. It allows you to define types for variables, function parameters, return values, and more. TypeScript catches type-related errors at compile-time, helping to prevent runtime bugs caused by incorrect data types.
Type Safety: Ensures that functions receive the correct types of arguments and that objects have the expected properties, reducing the risk of runtime errors.
Enhanced IDE Support: Provides improved autocompletion, refactoring tools, and inline documentation in IDEs, making development more efficient and less error-prone.
PropTypes: For React projects not using TypeScript, PropTypes is an alternative for type checking. It allows you to define expected types for component props, helping to catch bugs where incorrect data is passed to components.
Runtime Validation: While PropTypes perform runtime checks rather than compile-time checks, they still provide a valuable layer of validation, especially in larger projects where components receive complex data structures.
Benefits:
Early Error Detection: Both TypeScript and PropTypes catch type-related errors early in the development process, reducing the likelihood of bugs reaching production.
Improved Readability: Consistent formatting with Prettier and explicit type definitions with TypeScript or PropTypes make the code more readable and maintainable.
Better Documentation: Type annotations serve as a form of documentation, making it clearer what each function or component expects and returns.
By integrating linting, static code analysis, code formatters, and type checkers into your React development workflow, you can significantly enhance the quality, consistency, and maintainability of your codebase, leading to a smoother development experience and more reliable applications.
Debugging React applications efficiently is key to improving code quality and application performance. Whether using React Developer Tools, console logging, or advanced tools like Redux DevTools, these debugging tips and tricks will help you effectively identify and resolve issues in your React code. Regularly practicing these techniques will strengthen your debugging skills and streamline the development process in your next React project.


This website uses cookies to analyze website traffic and optimize your website experience. By continuing, you agree to our use of cookies as described in our Privacy Policy.